Recipe that runs an example diagnostic written in Python.
Example recipe that plots a map and timeseries of temperature.
Authors
Maintainers
Projects
- DLR project ESMVal
- Copernicus Climate Change Service 34a Lot 2 (MAGIC) project
References
- Please acknowledge the project(s).
Timeseries
Annual mean temperature in Amsterdam and global mean since 1850.
Timeseries: Script1
 Average Near-Surface Air Temperature between 1850 and 2000 according to BCC-ESM1.
download |
references |
extra data citation |
provenance
 Average Near-Surface Air Temperature between 1850 and 2000 according to BCC-ESM1.
download |
references |
extra data citation |
provenance
 Average Near-Surface Air Temperature between 1850 and 2000 according to CanESM2.
download |
references |
extra data citation |
provenance
 Average Near-Surface Air Temperature between 1850 and 2000 according to MultiModelMean.
download |
references |
extra data citation |
provenance
 Average Near-Surface Air Temperature between 1850 and 2000 according to CanESM2.
download |
references |
extra data citation |
provenance
Data files
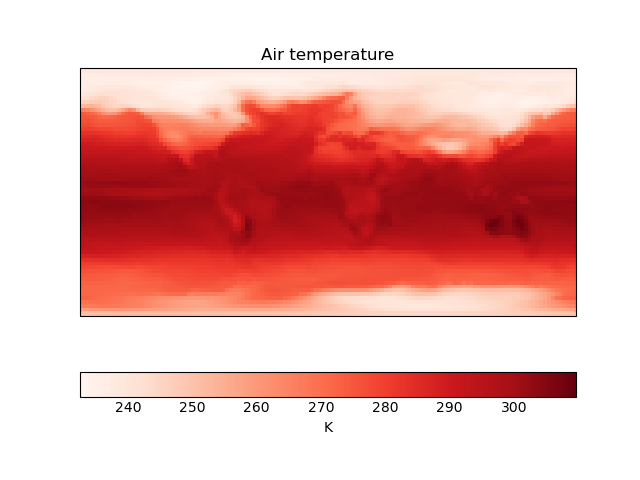
Map
Global map of temperature in January 2000.
Map: Script1
 Average Near-Surface Air Temperature between 2000 and 2000 according to CanESM2.
download |
references |
extra data citation |
provenance
 Average Near-Surface Air Temperature between 2000 and 2000 according to BCC-ESM1.
download |
references |
extra data citation |
provenance
Data files