J. M. Gregory and P. M. Forster.
Transient climate response estimated from radiative forcing and observed temperature change.
Journal of Geophysical Research, dec 2008.
doi:10.1029/2008jd010405.
Realms
Plot Types
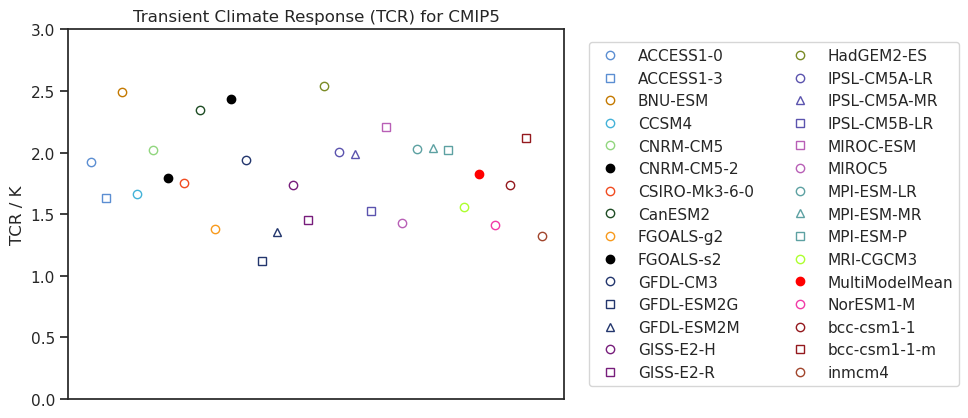
Cmip5
Calculate TCR for all available CMIP5 models.
Cmip5: Tcr
Time series of the global annual mean near-surface air temperature anomaly ΔT of the 1% CO2 increase per year experiment for model ACCESS1-0 (ensemble member r1i1p1). Anomalies are calculated relative to a pre-industrial control simulation of the same model. The horizontal dashed line indicates the transient climate response (TCR) defined as the 20-year average ΔT centered at the time of CO2 doubling (vertical dashed lines).
Time series of the global annual mean near-surface air temperature anomaly ΔT of the 1% CO2 increase per year experiment for model ACCESS1-3 (ensemble member r1i1p1). Anomalies are calculated relative to a pre-industrial control simulation of the same model. The horizontal dashed line indicates the transient climate response (TCR) defined as the 20-year average ΔT centered at the time of CO2 doubling (vertical dashed lines).
Time series of the global annual mean near-surface air temperature anomaly ΔT of the 1% CO2 increase per year experiment for model BNU-ESM (ensemble member r1i1p1). Anomalies are calculated relative to a pre-industrial control simulation of the same model. The horizontal dashed line indicates the transient climate response (TCR) defined as the 20-year average ΔT centered at the time of CO2 doubling (vertical dashed lines).
Time series of the global annual mean near-surface air temperature anomaly ΔT of the 1% CO2 increase per year experiment for model CCSM4 (ensemble member r1i1p1). Anomalies are calculated relative to a pre-industrial control simulation of the same model. The horizontal dashed line indicates the transient climate response (TCR) defined as the 20-year average ΔT centered at the time of CO2 doubling (vertical dashed lines).
Time series of the global annual mean near-surface air temperature anomaly ΔT of the 1% CO2 increase per year experiment for model CNRM-CM5-2 (ensemble member r1i1p1). Anomalies are calculated relative to a pre-industrial control simulation of the same model. The horizontal dashed line indicates the transient climate response (TCR) defined as the 20-year average ΔT centered at the time of CO2 doubling (vertical dashed lines).
Time series of the global annual mean near-surface air temperature anomaly ΔT of the 1% CO2 increase per year experiment for model CNRM-CM5 (ensemble member r1i1p1). Anomalies are calculated relative to a pre-industrial control simulation of the same model. The horizontal dashed line indicates the transient climate response (TCR) defined as the 20-year average ΔT centered at the time of CO2 doubling (vertical dashed lines).
Time series of the global annual mean near-surface air temperature anomaly ΔT of the 1% CO2 increase per year experiment for model CSIRO-Mk3-6-0 (ensemble member r1i1p1). Anomalies are calculated relative to a pre-industrial control simulation of the same model. The horizontal dashed line indicates the transient climate response (TCR) defined as the 20-year average ΔT centered at the time of CO2 doubling (vertical dashed lines).
Time series of the global annual mean near-surface air temperature anomaly ΔT of the 1% CO2 increase per year experiment for model CanESM2 (ensemble member r1i1p1). Anomalies are calculated relative to a pre-industrial control simulation of the same model. The horizontal dashed line indicates the transient climate response (TCR) defined as the 20-year average ΔT centered at the time of CO2 doubling (vertical dashed lines).
Time series of the global annual mean near-surface air temperature anomaly ΔT of the 1% CO2 increase per year experiment for model FGOALS-g2 (ensemble member r1i1p1). Anomalies are calculated relative to a pre-industrial control simulation of the same model. The horizontal dashed line indicates the transient climate response (TCR) defined as the 20-year average ΔT centered at the time of CO2 doubling (vertical dashed lines).
Time series of the global annual mean near-surface air temperature anomaly ΔT of the 1% CO2 increase per year experiment for model FGOALS-s2 (ensemble member r1i1p1). Anomalies are calculated relative to a pre-industrial control simulation of the same model. The horizontal dashed line indicates the transient climate response (TCR) defined as the 20-year average ΔT centered at the time of CO2 doubling (vertical dashed lines).
Time series of the global annual mean near-surface air temperature anomaly ΔT of the 1% CO2 increase per year experiment for model GFDL-CM3 (ensemble member r1i1p1). Anomalies are calculated relative to a pre-industrial control simulation of the same model. The horizontal dashed line indicates the transient climate response (TCR) defined as the 20-year average ΔT centered at the time of CO2 doubling (vertical dashed lines).
Time series of the global annual mean near-surface air temperature anomaly ΔT of the 1% CO2 increase per year experiment for model GFDL-ESM2G (ensemble member r1i1p1). Anomalies are calculated relative to a pre-industrial control simulation of the same model. The horizontal dashed line indicates the transient climate response (TCR) defined as the 20-year average ΔT centered at the time of CO2 doubling (vertical dashed lines).
Time series of the global annual mean near-surface air temperature anomaly ΔT of the 1% CO2 increase per year experiment for model GFDL-ESM2M (ensemble member r1i1p1). Anomalies are calculated relative to a pre-industrial control simulation of the same model. The horizontal dashed line indicates the transient climate response (TCR) defined as the 20-year average ΔT centered at the time of CO2 doubling (vertical dashed lines).
Time series of the global annual mean near-surface air temperature anomaly ΔT of the 1% CO2 increase per year experiment for model GISS-E2-H (ensemble member r1i1p1). Anomalies are calculated relative to a pre-industrial control simulation of the same model. The horizontal dashed line indicates the transient climate response (TCR) defined as the 20-year average ΔT centered at the time of CO2 doubling (vertical dashed lines).
Time series of the global annual mean near-surface air temperature anomaly ΔT of the 1% CO2 increase per year experiment for model GISS-E2-R (ensemble member r1i1p1). Anomalies are calculated relative to a pre-industrial control simulation of the same model. The horizontal dashed line indicates the transient climate response (TCR) defined as the 20-year average ΔT centered at the time of CO2 doubling (vertical dashed lines).
Time series of the global annual mean near-surface air temperature anomaly ΔT of the 1% CO2 increase per year experiment for model HadGEM2-ES (ensemble member r1i1p1). Anomalies are calculated relative to a pre-industrial control simulation of the same model. The horizontal dashed line indicates the transient climate response (TCR) defined as the 20-year average ΔT centered at the time of CO2 doubling (vertical dashed lines).
Time series of the global annual mean near-surface air temperature anomaly ΔT of the 1% CO2 increase per year experiment for model IPSL-CM5A-LR (ensemble member r1i1p1). Anomalies are calculated relative to a pre-industrial control simulation of the same model. The horizontal dashed line indicates the transient climate response (TCR) defined as the 20-year average ΔT centered at the time of CO2 doubling (vertical dashed lines).
Time series of the global annual mean near-surface air temperature anomaly ΔT of the 1% CO2 increase per year experiment for model IPSL-CM5A-MR (ensemble member r1i1p1). Anomalies are calculated relative to a pre-industrial control simulation of the same model. The horizontal dashed line indicates the transient climate response (TCR) defined as the 20-year average ΔT centered at the time of CO2 doubling (vertical dashed lines).
Time series of the global annual mean near-surface air temperature anomaly ΔT of the 1% CO2 increase per year experiment for model IPSL-CM5B-LR (ensemble member r1i1p1). Anomalies are calculated relative to a pre-industrial control simulation of the same model. The horizontal dashed line indicates the transient climate response (TCR) defined as the 20-year average ΔT centered at the time of CO2 doubling (vertical dashed lines).
Time series of the global annual mean near-surface air temperature anomaly ΔT of the 1% CO2 increase per year experiment for model MIROC-ESM (ensemble member r1i1p1). Anomalies are calculated relative to a pre-industrial control simulation of the same model. The horizontal dashed line indicates the transient climate response (TCR) defined as the 20-year average ΔT centered at the time of CO2 doubling (vertical dashed lines).
Time series of the global annual mean near-surface air temperature anomaly ΔT of the 1% CO2 increase per year experiment for model MIROC5 (ensemble member r1i1p1). Anomalies are calculated relative to a pre-industrial control simulation of the same model. The horizontal dashed line indicates the transient climate response (TCR) defined as the 20-year average ΔT centered at the time of CO2 doubling (vertical dashed lines).
Time series of the global annual mean near-surface air temperature anomaly ΔT of the 1% CO2 increase per year experiment for model MPI-ESM-LR (ensemble member r1i1p1). Anomalies are calculated relative to a pre-industrial control simulation of the same model. The horizontal dashed line indicates the transient climate response (TCR) defined as the 20-year average ΔT centered at the time of CO2 doubling (vertical dashed lines).
Time series of the global annual mean near-surface air temperature anomaly ΔT of the 1% CO2 increase per year experiment for model MPI-ESM-MR (ensemble member r1i1p1). Anomalies are calculated relative to a pre-industrial control simulation of the same model. The horizontal dashed line indicates the transient climate response (TCR) defined as the 20-year average ΔT centered at the time of CO2 doubling (vertical dashed lines).
Time series of the global annual mean near-surface air temperature anomaly ΔT of the 1% CO2 increase per year experiment for model MPI-ESM-P (ensemble member r1i1p1). Anomalies are calculated relative to a pre-industrial control simulation of the same model. The horizontal dashed line indicates the transient climate response (TCR) defined as the 20-year average ΔT centered at the time of CO2 doubling (vertical dashed lines).
Time series of the global annual mean near-surface air temperature anomaly ΔT of the 1% CO2 increase per year experiment for model MRI-CGCM3 (ensemble member r1i1p1). Anomalies are calculated relative to a pre-industrial control simulation of the same model. The horizontal dashed line indicates the transient climate response (TCR) defined as the 20-year average ΔT centered at the time of CO2 doubling (vertical dashed lines).
Time series of the global annual mean near-surface air temperature anomaly ΔT of the 1% CO2 increase per year experiment for model MultiModelMean. Anomalies are calculated relative to a pre-industrial control simulation of the same model. The horizontal dashed line indicates the transient climate response (TCR) defined as the 20-year average ΔT centered at the time of CO2 doubling (vertical dashed lines).
Time series of the global annual mean near-surface air temperature anomaly ΔT of the 1% CO2 increase per year experiment for model NorESM1-M (ensemble member r1i1p1). Anomalies are calculated relative to a pre-industrial control simulation of the same model. The horizontal dashed line indicates the transient climate response (TCR) defined as the 20-year average ΔT centered at the time of CO2 doubling (vertical dashed lines).
Time series of the global annual mean near-surface air temperature anomaly ΔT of the 1% CO2 increase per year experiment for model bcc-csm1-1-m (ensemble member r1i1p1). Anomalies are calculated relative to a pre-industrial control simulation of the same model. The horizontal dashed line indicates the transient climate response (TCR) defined as the 20-year average ΔT centered at the time of CO2 doubling (vertical dashed lines).
Time series of the global annual mean near-surface air temperature anomaly ΔT of the 1% CO2 increase per year experiment for model bcc-csm1-1 (ensemble member r1i1p1). Anomalies are calculated relative to a pre-industrial control simulation of the same model. The horizontal dashed line indicates the transient climate response (TCR) defined as the 20-year average ΔT centered at the time of CO2 doubling (vertical dashed lines).
Time series of the global annual mean near-surface air temperature anomaly ΔT of the 1% CO2 increase per year experiment for model inmcm4 (ensemble member r1i1p1). Anomalies are calculated relative to a pre-industrial control simulation of the same model. The horizontal dashed line indicates the transient climate response (TCR) defined as the 20-year average ΔT centered at the time of CO2 doubling (vertical dashed lines).
Time series of the global annual mean near-surface air temperature anomaly ΔT of the 1% CO2 increase per year experiment for model ACCESS1-0 (ensemble member r1i1p1). Anomalies are calculated relative to a pre-industrial control simulation of the same model. The horizontal dashed line indicates the transient climate response (TCR) defined as the 20-year average ΔT centered at the time of CO2 doubling (vertical dashed lines). |
download |
references |
extra data citation |
provenance
Time series of the global annual mean near-surface air temperature anomaly ΔT of the 1% CO2 increase per year experiment for model ACCESS1-3 (ensemble member r1i1p1). Anomalies are calculated relative to a pre-industrial control simulation of the same model. The horizontal dashed line indicates the transient climate response (TCR) defined as the 20-year average ΔT centered at the time of CO2 doubling (vertical dashed lines). |
download |
references |
extra data citation |
provenance
Time series of the global annual mean near-surface air temperature anomaly ΔT of the 1% CO2 increase per year experiment for model BNU-ESM (ensemble member r1i1p1). Anomalies are calculated relative to a pre-industrial control simulation of the same model. The horizontal dashed line indicates the transient climate response (TCR) defined as the 20-year average ΔT centered at the time of CO2 doubling (vertical dashed lines). |
download |
references |
extra data citation |
provenance
Time series of the global annual mean near-surface air temperature anomaly ΔT of the 1% CO2 increase per year experiment for model CCSM4 (ensemble member r1i1p1). Anomalies are calculated relative to a pre-industrial control simulation of the same model. The horizontal dashed line indicates the transient climate response (TCR) defined as the 20-year average ΔT centered at the time of CO2 doubling (vertical dashed lines). |
download |
references |
extra data citation |
provenance
Time series of the global annual mean near-surface air temperature anomaly ΔT of the 1% CO2 increase per year experiment for model CNRM-CM5-2 (ensemble member r1i1p1). Anomalies are calculated relative to a pre-industrial control simulation of the same model. The horizontal dashed line indicates the transient climate response (TCR) defined as the 20-year average ΔT centered at the time of CO2 doubling (vertical dashed lines). |
download |
references |
extra data citation |
provenance
Time series of the global annual mean near-surface air temperature anomaly ΔT of the 1% CO2 increase per year experiment for model CNRM-CM5 (ensemble member r1i1p1). Anomalies are calculated relative to a pre-industrial control simulation of the same model. The horizontal dashed line indicates the transient climate response (TCR) defined as the 20-year average ΔT centered at the time of CO2 doubling (vertical dashed lines). |
download |
references |
extra data citation |
provenance
Time series of the global annual mean near-surface air temperature anomaly ΔT of the 1% CO2 increase per year experiment for model CSIRO-Mk3-6-0 (ensemble member r1i1p1). Anomalies are calculated relative to a pre-industrial control simulation of the same model. The horizontal dashed line indicates the transient climate response (TCR) defined as the 20-year average ΔT centered at the time of CO2 doubling (vertical dashed lines). |
download |
references |
extra data citation |
provenance
Time series of the global annual mean near-surface air temperature anomaly ΔT of the 1% CO2 increase per year experiment for model CanESM2 (ensemble member r1i1p1). Anomalies are calculated relative to a pre-industrial control simulation of the same model. The horizontal dashed line indicates the transient climate response (TCR) defined as the 20-year average ΔT centered at the time of CO2 doubling (vertical dashed lines). |
download |
references |
extra data citation |
provenance
Time series of the global annual mean near-surface air temperature anomaly ΔT of the 1% CO2 increase per year experiment for model FGOALS-g2 (ensemble member r1i1p1). Anomalies are calculated relative to a pre-industrial control simulation of the same model. The horizontal dashed line indicates the transient climate response (TCR) defined as the 20-year average ΔT centered at the time of CO2 doubling (vertical dashed lines). |
download |
references |
extra data citation |
provenance
Time series of the global annual mean near-surface air temperature anomaly ΔT of the 1% CO2 increase per year experiment for model FGOALS-s2 (ensemble member r1i1p1). Anomalies are calculated relative to a pre-industrial control simulation of the same model. The horizontal dashed line indicates the transient climate response (TCR) defined as the 20-year average ΔT centered at the time of CO2 doubling (vertical dashed lines). |
download |
references |
extra data citation |
provenance
Time series of the global annual mean near-surface air temperature anomaly ΔT of the 1% CO2 increase per year experiment for model GFDL-CM3 (ensemble member r1i1p1). Anomalies are calculated relative to a pre-industrial control simulation of the same model. The horizontal dashed line indicates the transient climate response (TCR) defined as the 20-year average ΔT centered at the time of CO2 doubling (vertical dashed lines). |
download |
references |
extra data citation |
provenance
Time series of the global annual mean near-surface air temperature anomaly ΔT of the 1% CO2 increase per year experiment for model GFDL-ESM2G (ensemble member r1i1p1). Anomalies are calculated relative to a pre-industrial control simulation of the same model. The horizontal dashed line indicates the transient climate response (TCR) defined as the 20-year average ΔT centered at the time of CO2 doubling (vertical dashed lines). |
download |
references |
extra data citation |
provenance
Time series of the global annual mean near-surface air temperature anomaly ΔT of the 1% CO2 increase per year experiment for model GFDL-ESM2M (ensemble member r1i1p1). Anomalies are calculated relative to a pre-industrial control simulation of the same model. The horizontal dashed line indicates the transient climate response (TCR) defined as the 20-year average ΔT centered at the time of CO2 doubling (vertical dashed lines). |
download |
references |
extra data citation |
provenance
Time series of the global annual mean near-surface air temperature anomaly ΔT of the 1% CO2 increase per year experiment for model GISS-E2-H (ensemble member r1i1p1). Anomalies are calculated relative to a pre-industrial control simulation of the same model. The horizontal dashed line indicates the transient climate response (TCR) defined as the 20-year average ΔT centered at the time of CO2 doubling (vertical dashed lines). |
download |
references |
extra data citation |
provenance
Time series of the global annual mean near-surface air temperature anomaly ΔT of the 1% CO2 increase per year experiment for model GISS-E2-R (ensemble member r1i1p1). Anomalies are calculated relative to a pre-industrial control simulation of the same model. The horizontal dashed line indicates the transient climate response (TCR) defined as the 20-year average ΔT centered at the time of CO2 doubling (vertical dashed lines). |
download |
references |
extra data citation |
provenance
Time series of the global annual mean near-surface air temperature anomaly ΔT of the 1% CO2 increase per year experiment for model HadGEM2-ES (ensemble member r1i1p1). Anomalies are calculated relative to a pre-industrial control simulation of the same model. The horizontal dashed line indicates the transient climate response (TCR) defined as the 20-year average ΔT centered at the time of CO2 doubling (vertical dashed lines). |
download |
references |
extra data citation |
provenance
Time series of the global annual mean near-surface air temperature anomaly ΔT of the 1% CO2 increase per year experiment for model IPSL-CM5A-LR (ensemble member r1i1p1). Anomalies are calculated relative to a pre-industrial control simulation of the same model. The horizontal dashed line indicates the transient climate response (TCR) defined as the 20-year average ΔT centered at the time of CO2 doubling (vertical dashed lines). |
download |
references |
extra data citation |
provenance
Time series of the global annual mean near-surface air temperature anomaly ΔT of the 1% CO2 increase per year experiment for model IPSL-CM5A-MR (ensemble member r1i1p1). Anomalies are calculated relative to a pre-industrial control simulation of the same model. The horizontal dashed line indicates the transient climate response (TCR) defined as the 20-year average ΔT centered at the time of CO2 doubling (vertical dashed lines). |
download |
references |
extra data citation |
provenance
Time series of the global annual mean near-surface air temperature anomaly ΔT of the 1% CO2 increase per year experiment for model IPSL-CM5B-LR (ensemble member r1i1p1). Anomalies are calculated relative to a pre-industrial control simulation of the same model. The horizontal dashed line indicates the transient climate response (TCR) defined as the 20-year average ΔT centered at the time of CO2 doubling (vertical dashed lines). |
download |
references |
extra data citation |
provenance
Time series of the global annual mean near-surface air temperature anomaly ΔT of the 1% CO2 increase per year experiment for model MIROC-ESM (ensemble member r1i1p1). Anomalies are calculated relative to a pre-industrial control simulation of the same model. The horizontal dashed line indicates the transient climate response (TCR) defined as the 20-year average ΔT centered at the time of CO2 doubling (vertical dashed lines). |
download |
references |
extra data citation |
provenance
Time series of the global annual mean near-surface air temperature anomaly ΔT of the 1% CO2 increase per year experiment for model MIROC5 (ensemble member r1i1p1). Anomalies are calculated relative to a pre-industrial control simulation of the same model. The horizontal dashed line indicates the transient climate response (TCR) defined as the 20-year average ΔT centered at the time of CO2 doubling (vertical dashed lines). |
download |
references |
extra data citation |
provenance
Time series of the global annual mean near-surface air temperature anomaly ΔT of the 1% CO2 increase per year experiment for model MPI-ESM-LR (ensemble member r1i1p1). Anomalies are calculated relative to a pre-industrial control simulation of the same model. The horizontal dashed line indicates the transient climate response (TCR) defined as the 20-year average ΔT centered at the time of CO2 doubling (vertical dashed lines). |
download |
references |
extra data citation |
provenance
Time series of the global annual mean near-surface air temperature anomaly ΔT of the 1% CO2 increase per year experiment for model MPI-ESM-MR (ensemble member r1i1p1). Anomalies are calculated relative to a pre-industrial control simulation of the same model. The horizontal dashed line indicates the transient climate response (TCR) defined as the 20-year average ΔT centered at the time of CO2 doubling (vertical dashed lines). |
download |
references |
extra data citation |
provenance
Time series of the global annual mean near-surface air temperature anomaly ΔT of the 1% CO2 increase per year experiment for model MPI-ESM-P (ensemble member r1i1p1). Anomalies are calculated relative to a pre-industrial control simulation of the same model. The horizontal dashed line indicates the transient climate response (TCR) defined as the 20-year average ΔT centered at the time of CO2 doubling (vertical dashed lines). |
download |
references |
extra data citation |
provenance
Time series of the global annual mean near-surface air temperature anomaly ΔT of the 1% CO2 increase per year experiment for model MRI-CGCM3 (ensemble member r1i1p1). Anomalies are calculated relative to a pre-industrial control simulation of the same model. The horizontal dashed line indicates the transient climate response (TCR) defined as the 20-year average ΔT centered at the time of CO2 doubling (vertical dashed lines). |
download |
references |
extra data citation |
provenance
Time series of the global annual mean near-surface air temperature anomaly ΔT of the 1% CO2 increase per year experiment for model MultiModelMean. Anomalies are calculated relative to a pre-industrial control simulation of the same model. The horizontal dashed line indicates the transient climate response (TCR) defined as the 20-year average ΔT centered at the time of CO2 doubling (vertical dashed lines). |
download |
references |
extra data citation |
provenance
Time series of the global annual mean near-surface air temperature anomaly ΔT of the 1% CO2 increase per year experiment for model NorESM1-M (ensemble member r1i1p1). Anomalies are calculated relative to a pre-industrial control simulation of the same model. The horizontal dashed line indicates the transient climate response (TCR) defined as the 20-year average ΔT centered at the time of CO2 doubling (vertical dashed lines). |
download |
references |
extra data citation |
provenance
Time series of the global annual mean near-surface air temperature anomaly ΔT of the 1% CO2 increase per year experiment for model bcc-csm1-1-m (ensemble member r1i1p1). Anomalies are calculated relative to a pre-industrial control simulation of the same model. The horizontal dashed line indicates the transient climate response (TCR) defined as the 20-year average ΔT centered at the time of CO2 doubling (vertical dashed lines). |
download |
references |
extra data citation |
provenance
Time series of the global annual mean near-surface air temperature anomaly ΔT of the 1% CO2 increase per year experiment for model bcc-csm1-1 (ensemble member r1i1p1). Anomalies are calculated relative to a pre-industrial control simulation of the same model. The horizontal dashed line indicates the transient climate response (TCR) defined as the 20-year average ΔT centered at the time of CO2 doubling (vertical dashed lines). |
download |
references |
extra data citation |
provenance
Time series of the global annual mean near-surface air temperature anomaly ΔT of the 1% CO2 increase per year experiment for model inmcm4 (ensemble member r1i1p1). Anomalies are calculated relative to a pre-industrial control simulation of the same model. The horizontal dashed line indicates the transient climate response (TCR) defined as the 20-year average ΔT centered at the time of CO2 doubling (vertical dashed lines). |
download |
references |
extra data citation |
provenance
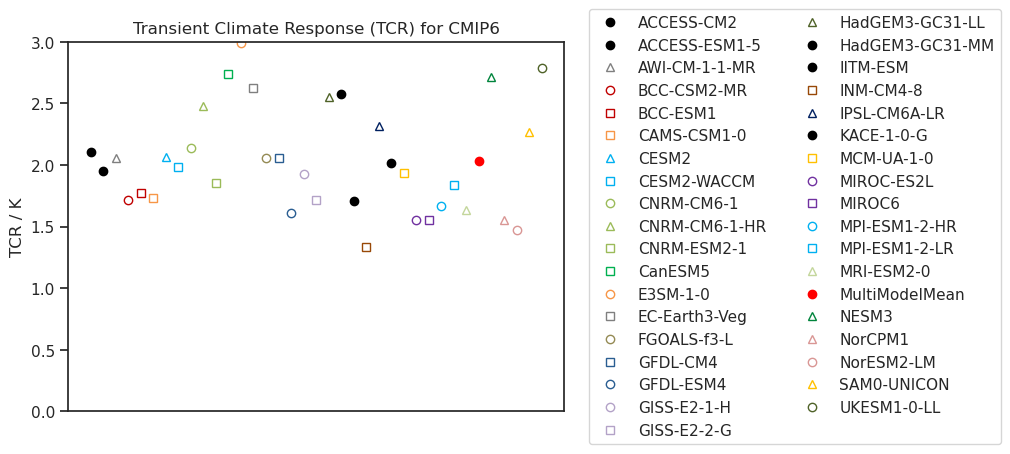
Time series of the global annual mean near-surface air temperature anomaly ΔT of the 1% CO2 increase per year experiment for model ACCESS-CM2 (ensemble member r1i1p1f1). Anomalies are calculated relative to a pre-industrial control simulation of the same model. The horizontal dashed line indicates the transient climate response (TCR) defined as the 20-year average ΔT centered at the time of CO2 doubling (vertical dashed lines).
Time series of the global annual mean near-surface air temperature anomaly ΔT of the 1% CO2 increase per year experiment for model ACCESS-ESM1-5 (ensemble member r1i1p1f1). Anomalies are calculated relative to a pre-industrial control simulation of the same model. The horizontal dashed line indicates the transient climate response (TCR) defined as the 20-year average ΔT centered at the time of CO2 doubling (vertical dashed lines).
Time series of the global annual mean near-surface air temperature anomaly ΔT of the 1% CO2 increase per year experiment for model AWI-CM-1-1-MR (ensemble member r1i1p1f1). Anomalies are calculated relative to a pre-industrial control simulation of the same model. The horizontal dashed line indicates the transient climate response (TCR) defined as the 20-year average ΔT centered at the time of CO2 doubling (vertical dashed lines).
Time series of the global annual mean near-surface air temperature anomaly ΔT of the 1% CO2 increase per year experiment for model BCC-CSM2-MR (ensemble member r1i1p1f1). Anomalies are calculated relative to a pre-industrial control simulation of the same model. The horizontal dashed line indicates the transient climate response (TCR) defined as the 20-year average ΔT centered at the time of CO2 doubling (vertical dashed lines).
Time series of the global annual mean near-surface air temperature anomaly ΔT of the 1% CO2 increase per year experiment for model BCC-ESM1 (ensemble member r1i1p1f1). Anomalies are calculated relative to a pre-industrial control simulation of the same model. The horizontal dashed line indicates the transient climate response (TCR) defined as the 20-year average ΔT centered at the time of CO2 doubling (vertical dashed lines).
Time series of the global annual mean near-surface air temperature anomaly ΔT of the 1% CO2 increase per year experiment for model CAMS-CSM1-0 (ensemble member r1i1p1f1). Anomalies are calculated relative to a pre-industrial control simulation of the same model. The horizontal dashed line indicates the transient climate response (TCR) defined as the 20-year average ΔT centered at the time of CO2 doubling (vertical dashed lines).
Time series of the global annual mean near-surface air temperature anomaly ΔT of the 1% CO2 increase per year experiment for model CESM2-WACCM (ensemble member r1i1p1f1). Anomalies are calculated relative to a pre-industrial control simulation of the same model. The horizontal dashed line indicates the transient climate response (TCR) defined as the 20-year average ΔT centered at the time of CO2 doubling (vertical dashed lines).
Time series of the global annual mean near-surface air temperature anomaly ΔT of the 1% CO2 increase per year experiment for model CESM2 (ensemble member r1i1p1f1). Anomalies are calculated relative to a pre-industrial control simulation of the same model. The horizontal dashed line indicates the transient climate response (TCR) defined as the 20-year average ΔT centered at the time of CO2 doubling (vertical dashed lines).
Time series of the global annual mean near-surface air temperature anomaly ΔT of the 1% CO2 increase per year experiment for model CNRM-CM6-1-HR (ensemble member r1i1p1f2). Anomalies are calculated relative to a pre-industrial control simulation of the same model. The horizontal dashed line indicates the transient climate response (TCR) defined as the 20-year average ΔT centered at the time of CO2 doubling (vertical dashed lines).
Time series of the global annual mean near-surface air temperature anomaly ΔT of the 1% CO2 increase per year experiment for model CNRM-CM6-1 (ensemble member r1i1p1f2). Anomalies are calculated relative to a pre-industrial control simulation of the same model. The horizontal dashed line indicates the transient climate response (TCR) defined as the 20-year average ΔT centered at the time of CO2 doubling (vertical dashed lines).
Time series of the global annual mean near-surface air temperature anomaly ΔT of the 1% CO2 increase per year experiment for model CNRM-ESM2-1 (ensemble member r1i1p1f2). Anomalies are calculated relative to a pre-industrial control simulation of the same model. The horizontal dashed line indicates the transient climate response (TCR) defined as the 20-year average ΔT centered at the time of CO2 doubling (vertical dashed lines).
Time series of the global annual mean near-surface air temperature anomaly ΔT of the 1% CO2 increase per year experiment for model CanESM5 (ensemble member r1i1p1f1). Anomalies are calculated relative to a pre-industrial control simulation of the same model. The horizontal dashed line indicates the transient climate response (TCR) defined as the 20-year average ΔT centered at the time of CO2 doubling (vertical dashed lines).
Time series of the global annual mean near-surface air temperature anomaly ΔT of the 1% CO2 increase per year experiment for model E3SM-1-0 (ensemble member r1i1p1f1). Anomalies are calculated relative to a pre-industrial control simulation of the same model. The horizontal dashed line indicates the transient climate response (TCR) defined as the 20-year average ΔT centered at the time of CO2 doubling (vertical dashed lines).
Time series of the global annual mean near-surface air temperature anomaly ΔT of the 1% CO2 increase per year experiment for model EC-Earth3-Veg (ensemble member r1i1p1f1). Anomalies are calculated relative to a pre-industrial control simulation of the same model. The horizontal dashed line indicates the transient climate response (TCR) defined as the 20-year average ΔT centered at the time of CO2 doubling (vertical dashed lines).
Time series of the global annual mean near-surface air temperature anomaly ΔT of the 1% CO2 increase per year experiment for model FGOALS-f3-L (ensemble member r1i1p1f1). Anomalies are calculated relative to a pre-industrial control simulation of the same model. The horizontal dashed line indicates the transient climate response (TCR) defined as the 20-year average ΔT centered at the time of CO2 doubling (vertical dashed lines).
Time series of the global annual mean near-surface air temperature anomaly ΔT of the 1% CO2 increase per year experiment for model GFDL-CM4 (ensemble member r1i1p1f1). Anomalies are calculated relative to a pre-industrial control simulation of the same model. The horizontal dashed line indicates the transient climate response (TCR) defined as the 20-year average ΔT centered at the time of CO2 doubling (vertical dashed lines).
Time series of the global annual mean near-surface air temperature anomaly ΔT of the 1% CO2 increase per year experiment for model GFDL-ESM4 (ensemble member r1i1p1f1). Anomalies are calculated relative to a pre-industrial control simulation of the same model. The horizontal dashed line indicates the transient climate response (TCR) defined as the 20-year average ΔT centered at the time of CO2 doubling (vertical dashed lines).
Time series of the global annual mean near-surface air temperature anomaly ΔT of the 1% CO2 increase per year experiment for model GISS-E2-1-H (ensemble member r1i1p1f1). Anomalies are calculated relative to a pre-industrial control simulation of the same model. The horizontal dashed line indicates the transient climate response (TCR) defined as the 20-year average ΔT centered at the time of CO2 doubling (vertical dashed lines).
Time series of the global annual mean near-surface air temperature anomaly ΔT of the 1% CO2 increase per year experiment for model GISS-E2-2-G (ensemble member r1i1p1f1). Anomalies are calculated relative to a pre-industrial control simulation of the same model. The horizontal dashed line indicates the transient climate response (TCR) defined as the 20-year average ΔT centered at the time of CO2 doubling (vertical dashed lines).
Time series of the global annual mean near-surface air temperature anomaly ΔT of the 1% CO2 increase per year experiment for model HadGEM3-GC31-LL (ensemble member r1i1p1f3). Anomalies are calculated relative to a pre-industrial control simulation of the same model. The horizontal dashed line indicates the transient climate response (TCR) defined as the 20-year average ΔT centered at the time of CO2 doubling (vertical dashed lines).
Time series of the global annual mean near-surface air temperature anomaly ΔT of the 1% CO2 increase per year experiment for model HadGEM3-GC31-MM (ensemble member r1i1p1f3). Anomalies are calculated relative to a pre-industrial control simulation of the same model. The horizontal dashed line indicates the transient climate response (TCR) defined as the 20-year average ΔT centered at the time of CO2 doubling (vertical dashed lines).
Time series of the global annual mean near-surface air temperature anomaly ΔT of the 1% CO2 increase per year experiment for model IITM-ESM (ensemble member r1i1p1f1). Anomalies are calculated relative to a pre-industrial control simulation of the same model. The horizontal dashed line indicates the transient climate response (TCR) defined as the 20-year average ΔT centered at the time of CO2 doubling (vertical dashed lines).
Time series of the global annual mean near-surface air temperature anomaly ΔT of the 1% CO2 increase per year experiment for model INM-CM4-8 (ensemble member r1i1p1f1). Anomalies are calculated relative to a pre-industrial control simulation of the same model. The horizontal dashed line indicates the transient climate response (TCR) defined as the 20-year average ΔT centered at the time of CO2 doubling (vertical dashed lines).
Time series of the global annual mean near-surface air temperature anomaly ΔT of the 1% CO2 increase per year experiment for model IPSL-CM6A-LR (ensemble member r1i1p1f1). Anomalies are calculated relative to a pre-industrial control simulation of the same model. The horizontal dashed line indicates the transient climate response (TCR) defined as the 20-year average ΔT centered at the time of CO2 doubling (vertical dashed lines).
Time series of the global annual mean near-surface air temperature anomaly ΔT of the 1% CO2 increase per year experiment for model KACE-1-0-G (ensemble member r1i1p1f1). Anomalies are calculated relative to a pre-industrial control simulation of the same model. The horizontal dashed line indicates the transient climate response (TCR) defined as the 20-year average ΔT centered at the time of CO2 doubling (vertical dashed lines).
Time series of the global annual mean near-surface air temperature anomaly ΔT of the 1% CO2 increase per year experiment for model MCM-UA-1-0 (ensemble member r1i1p1f1). Anomalies are calculated relative to a pre-industrial control simulation of the same model. The horizontal dashed line indicates the transient climate response (TCR) defined as the 20-year average ΔT centered at the time of CO2 doubling (vertical dashed lines).
Time series of the global annual mean near-surface air temperature anomaly ΔT of the 1% CO2 increase per year experiment for model MIROC-ES2L (ensemble member r1i1p1f2). Anomalies are calculated relative to a pre-industrial control simulation of the same model. The horizontal dashed line indicates the transient climate response (TCR) defined as the 20-year average ΔT centered at the time of CO2 doubling (vertical dashed lines).
Time series of the global annual mean near-surface air temperature anomaly ΔT of the 1% CO2 increase per year experiment for model MIROC6 (ensemble member r1i1p1f1). Anomalies are calculated relative to a pre-industrial control simulation of the same model. The horizontal dashed line indicates the transient climate response (TCR) defined as the 20-year average ΔT centered at the time of CO2 doubling (vertical dashed lines).
Time series of the global annual mean near-surface air temperature anomaly ΔT of the 1% CO2 increase per year experiment for model MPI-ESM1-2-HR (ensemble member r1i1p1f1). Anomalies are calculated relative to a pre-industrial control simulation of the same model. The horizontal dashed line indicates the transient climate response (TCR) defined as the 20-year average ΔT centered at the time of CO2 doubling (vertical dashed lines).
Time series of the global annual mean near-surface air temperature anomaly ΔT of the 1% CO2 increase per year experiment for model MPI-ESM1-2-LR (ensemble member r1i1p1f1). Anomalies are calculated relative to a pre-industrial control simulation of the same model. The horizontal dashed line indicates the transient climate response (TCR) defined as the 20-year average ΔT centered at the time of CO2 doubling (vertical dashed lines).
Time series of the global annual mean near-surface air temperature anomaly ΔT of the 1% CO2 increase per year experiment for model MRI-ESM2-0 (ensemble member r1i1p1f1). Anomalies are calculated relative to a pre-industrial control simulation of the same model. The horizontal dashed line indicates the transient climate response (TCR) defined as the 20-year average ΔT centered at the time of CO2 doubling (vertical dashed lines).
Time series of the global annual mean near-surface air temperature anomaly ΔT of the 1% CO2 increase per year experiment for model MultiModelMean. Anomalies are calculated relative to a pre-industrial control simulation of the same model. The horizontal dashed line indicates the transient climate response (TCR) defined as the 20-year average ΔT centered at the time of CO2 doubling (vertical dashed lines).
Time series of the global annual mean near-surface air temperature anomaly ΔT of the 1% CO2 increase per year experiment for model NESM3 (ensemble member r1i1p1f1). Anomalies are calculated relative to a pre-industrial control simulation of the same model. The horizontal dashed line indicates the transient climate response (TCR) defined as the 20-year average ΔT centered at the time of CO2 doubling (vertical dashed lines).
Time series of the global annual mean near-surface air temperature anomaly ΔT of the 1% CO2 increase per year experiment for model NorCPM1 (ensemble member r1i1p1f1). Anomalies are calculated relative to a pre-industrial control simulation of the same model. The horizontal dashed line indicates the transient climate response (TCR) defined as the 20-year average ΔT centered at the time of CO2 doubling (vertical dashed lines).
Time series of the global annual mean near-surface air temperature anomaly ΔT of the 1% CO2 increase per year experiment for model NorESM2-LM (ensemble member r1i1p1f1). Anomalies are calculated relative to a pre-industrial control simulation of the same model. The horizontal dashed line indicates the transient climate response (TCR) defined as the 20-year average ΔT centered at the time of CO2 doubling (vertical dashed lines).
Time series of the global annual mean near-surface air temperature anomaly ΔT of the 1% CO2 increase per year experiment for model SAM0-UNICON (ensemble member r1i1p1f1). Anomalies are calculated relative to a pre-industrial control simulation of the same model. The horizontal dashed line indicates the transient climate response (TCR) defined as the 20-year average ΔT centered at the time of CO2 doubling (vertical dashed lines).
Time series of the global annual mean near-surface air temperature anomaly ΔT of the 1% CO2 increase per year experiment for model UKESM1-0-LL (ensemble member r1i1p1f2). Anomalies are calculated relative to a pre-industrial control simulation of the same model. The horizontal dashed line indicates the transient climate response (TCR) defined as the 20-year average ΔT centered at the time of CO2 doubling (vertical dashed lines).
Time series of the global annual mean near-surface air temperature anomaly ΔT of the 1% CO2 increase per year experiment for model ACCESS-CM2 (ensemble member r1i1p1f1). Anomalies are calculated relative to a pre-industrial control simulation of the same model. The horizontal dashed line indicates the transient climate response (TCR) defined as the 20-year average ΔT centered at the time of CO2 doubling (vertical dashed lines). |
download |
references |
extra data citation |
provenance
Time series of the global annual mean near-surface air temperature anomaly ΔT of the 1% CO2 increase per year experiment for model ACCESS-ESM1-5 (ensemble member r1i1p1f1). Anomalies are calculated relative to a pre-industrial control simulation of the same model. The horizontal dashed line indicates the transient climate response (TCR) defined as the 20-year average ΔT centered at the time of CO2 doubling (vertical dashed lines). |
download |
references |
extra data citation |
provenance
Time series of the global annual mean near-surface air temperature anomaly ΔT of the 1% CO2 increase per year experiment for model AWI-CM-1-1-MR (ensemble member r1i1p1f1). Anomalies are calculated relative to a pre-industrial control simulation of the same model. The horizontal dashed line indicates the transient climate response (TCR) defined as the 20-year average ΔT centered at the time of CO2 doubling (vertical dashed lines). |
download |
references |
extra data citation |
provenance
Time series of the global annual mean near-surface air temperature anomaly ΔT of the 1% CO2 increase per year experiment for model BCC-CSM2-MR (ensemble member r1i1p1f1). Anomalies are calculated relative to a pre-industrial control simulation of the same model. The horizontal dashed line indicates the transient climate response (TCR) defined as the 20-year average ΔT centered at the time of CO2 doubling (vertical dashed lines). |
download |
references |
extra data citation |
provenance
Time series of the global annual mean near-surface air temperature anomaly ΔT of the 1% CO2 increase per year experiment for model BCC-ESM1 (ensemble member r1i1p1f1). Anomalies are calculated relative to a pre-industrial control simulation of the same model. The horizontal dashed line indicates the transient climate response (TCR) defined as the 20-year average ΔT centered at the time of CO2 doubling (vertical dashed lines). |
download |
references |
extra data citation |
provenance
Time series of the global annual mean near-surface air temperature anomaly ΔT of the 1% CO2 increase per year experiment for model CAMS-CSM1-0 (ensemble member r1i1p1f1). Anomalies are calculated relative to a pre-industrial control simulation of the same model. The horizontal dashed line indicates the transient climate response (TCR) defined as the 20-year average ΔT centered at the time of CO2 doubling (vertical dashed lines). |
download |
references |
extra data citation |
provenance
Time series of the global annual mean near-surface air temperature anomaly ΔT of the 1% CO2 increase per year experiment for model CESM2-WACCM (ensemble member r1i1p1f1). Anomalies are calculated relative to a pre-industrial control simulation of the same model. The horizontal dashed line indicates the transient climate response (TCR) defined as the 20-year average ΔT centered at the time of CO2 doubling (vertical dashed lines). |
download |
references |
extra data citation |
provenance
Time series of the global annual mean near-surface air temperature anomaly ΔT of the 1% CO2 increase per year experiment for model CESM2 (ensemble member r1i1p1f1). Anomalies are calculated relative to a pre-industrial control simulation of the same model. The horizontal dashed line indicates the transient climate response (TCR) defined as the 20-year average ΔT centered at the time of CO2 doubling (vertical dashed lines). |
download |
references |
extra data citation |
provenance
Time series of the global annual mean near-surface air temperature anomaly ΔT of the 1% CO2 increase per year experiment for model CNRM-CM6-1-HR (ensemble member r1i1p1f2). Anomalies are calculated relative to a pre-industrial control simulation of the same model. The horizontal dashed line indicates the transient climate response (TCR) defined as the 20-year average ΔT centered at the time of CO2 doubling (vertical dashed lines). |
download |
references |
extra data citation |
provenance
Time series of the global annual mean near-surface air temperature anomaly ΔT of the 1% CO2 increase per year experiment for model CNRM-CM6-1 (ensemble member r1i1p1f2). Anomalies are calculated relative to a pre-industrial control simulation of the same model. The horizontal dashed line indicates the transient climate response (TCR) defined as the 20-year average ΔT centered at the time of CO2 doubling (vertical dashed lines). |
download |
references |
extra data citation |
provenance
Time series of the global annual mean near-surface air temperature anomaly ΔT of the 1% CO2 increase per year experiment for model CNRM-ESM2-1 (ensemble member r1i1p1f2). Anomalies are calculated relative to a pre-industrial control simulation of the same model. The horizontal dashed line indicates the transient climate response (TCR) defined as the 20-year average ΔT centered at the time of CO2 doubling (vertical dashed lines). |
download |
references |
extra data citation |
provenance
Time series of the global annual mean near-surface air temperature anomaly ΔT of the 1% CO2 increase per year experiment for model CanESM5 (ensemble member r1i1p1f1). Anomalies are calculated relative to a pre-industrial control simulation of the same model. The horizontal dashed line indicates the transient climate response (TCR) defined as the 20-year average ΔT centered at the time of CO2 doubling (vertical dashed lines). |
download |
references |
extra data citation |
provenance
Time series of the global annual mean near-surface air temperature anomaly ΔT of the 1% CO2 increase per year experiment for model E3SM-1-0 (ensemble member r1i1p1f1). Anomalies are calculated relative to a pre-industrial control simulation of the same model. The horizontal dashed line indicates the transient climate response (TCR) defined as the 20-year average ΔT centered at the time of CO2 doubling (vertical dashed lines). |
download |
references |
extra data citation |
provenance
Time series of the global annual mean near-surface air temperature anomaly ΔT of the 1% CO2 increase per year experiment for model EC-Earth3-Veg (ensemble member r1i1p1f1). Anomalies are calculated relative to a pre-industrial control simulation of the same model. The horizontal dashed line indicates the transient climate response (TCR) defined as the 20-year average ΔT centered at the time of CO2 doubling (vertical dashed lines). |
download |
references |
extra data citation |
provenance
Time series of the global annual mean near-surface air temperature anomaly ΔT of the 1% CO2 increase per year experiment for model FGOALS-f3-L (ensemble member r1i1p1f1). Anomalies are calculated relative to a pre-industrial control simulation of the same model. The horizontal dashed line indicates the transient climate response (TCR) defined as the 20-year average ΔT centered at the time of CO2 doubling (vertical dashed lines). |
download |
references |
extra data citation |
provenance
Time series of the global annual mean near-surface air temperature anomaly ΔT of the 1% CO2 increase per year experiment for model GFDL-CM4 (ensemble member r1i1p1f1). Anomalies are calculated relative to a pre-industrial control simulation of the same model. The horizontal dashed line indicates the transient climate response (TCR) defined as the 20-year average ΔT centered at the time of CO2 doubling (vertical dashed lines). |
download |
references |
extra data citation |
provenance
Time series of the global annual mean near-surface air temperature anomaly ΔT of the 1% CO2 increase per year experiment for model GFDL-ESM4 (ensemble member r1i1p1f1). Anomalies are calculated relative to a pre-industrial control simulation of the same model. The horizontal dashed line indicates the transient climate response (TCR) defined as the 20-year average ΔT centered at the time of CO2 doubling (vertical dashed lines). |
download |
references |
extra data citation |
provenance
Time series of the global annual mean near-surface air temperature anomaly ΔT of the 1% CO2 increase per year experiment for model GISS-E2-1-H (ensemble member r1i1p1f1). Anomalies are calculated relative to a pre-industrial control simulation of the same model. The horizontal dashed line indicates the transient climate response (TCR) defined as the 20-year average ΔT centered at the time of CO2 doubling (vertical dashed lines). |
download |
references |
extra data citation |
provenance
Time series of the global annual mean near-surface air temperature anomaly ΔT of the 1% CO2 increase per year experiment for model GISS-E2-2-G (ensemble member r1i1p1f1). Anomalies are calculated relative to a pre-industrial control simulation of the same model. The horizontal dashed line indicates the transient climate response (TCR) defined as the 20-year average ΔT centered at the time of CO2 doubling (vertical dashed lines). |
download |
references |
extra data citation |
provenance
Time series of the global annual mean near-surface air temperature anomaly ΔT of the 1% CO2 increase per year experiment for model HadGEM3-GC31-LL (ensemble member r1i1p1f3). Anomalies are calculated relative to a pre-industrial control simulation of the same model. The horizontal dashed line indicates the transient climate response (TCR) defined as the 20-year average ΔT centered at the time of CO2 doubling (vertical dashed lines). |
download |
references |
extra data citation |
provenance
Time series of the global annual mean near-surface air temperature anomaly ΔT of the 1% CO2 increase per year experiment for model HadGEM3-GC31-MM (ensemble member r1i1p1f3). Anomalies are calculated relative to a pre-industrial control simulation of the same model. The horizontal dashed line indicates the transient climate response (TCR) defined as the 20-year average ΔT centered at the time of CO2 doubling (vertical dashed lines). |
download |
references |
extra data citation |
provenance
Time series of the global annual mean near-surface air temperature anomaly ΔT of the 1% CO2 increase per year experiment for model IITM-ESM (ensemble member r1i1p1f1). Anomalies are calculated relative to a pre-industrial control simulation of the same model. The horizontal dashed line indicates the transient climate response (TCR) defined as the 20-year average ΔT centered at the time of CO2 doubling (vertical dashed lines). |
download |
references |
extra data citation |
provenance
Time series of the global annual mean near-surface air temperature anomaly ΔT of the 1% CO2 increase per year experiment for model INM-CM4-8 (ensemble member r1i1p1f1). Anomalies are calculated relative to a pre-industrial control simulation of the same model. The horizontal dashed line indicates the transient climate response (TCR) defined as the 20-year average ΔT centered at the time of CO2 doubling (vertical dashed lines). |
download |
references |
extra data citation |
provenance
Time series of the global annual mean near-surface air temperature anomaly ΔT of the 1% CO2 increase per year experiment for model IPSL-CM6A-LR (ensemble member r1i1p1f1). Anomalies are calculated relative to a pre-industrial control simulation of the same model. The horizontal dashed line indicates the transient climate response (TCR) defined as the 20-year average ΔT centered at the time of CO2 doubling (vertical dashed lines). |
download |
references |
extra data citation |
provenance
Time series of the global annual mean near-surface air temperature anomaly ΔT of the 1% CO2 increase per year experiment for model KACE-1-0-G (ensemble member r1i1p1f1). Anomalies are calculated relative to a pre-industrial control simulation of the same model. The horizontal dashed line indicates the transient climate response (TCR) defined as the 20-year average ΔT centered at the time of CO2 doubling (vertical dashed lines). |
download |
references |
extra data citation |
provenance
Time series of the global annual mean near-surface air temperature anomaly ΔT of the 1% CO2 increase per year experiment for model MCM-UA-1-0 (ensemble member r1i1p1f1). Anomalies are calculated relative to a pre-industrial control simulation of the same model. The horizontal dashed line indicates the transient climate response (TCR) defined as the 20-year average ΔT centered at the time of CO2 doubling (vertical dashed lines). |
download |
references |
extra data citation |
provenance
Time series of the global annual mean near-surface air temperature anomaly ΔT of the 1% CO2 increase per year experiment for model MIROC-ES2L (ensemble member r1i1p1f2). Anomalies are calculated relative to a pre-industrial control simulation of the same model. The horizontal dashed line indicates the transient climate response (TCR) defined as the 20-year average ΔT centered at the time of CO2 doubling (vertical dashed lines). |
download |
references |
extra data citation |
provenance
Time series of the global annual mean near-surface air temperature anomaly ΔT of the 1% CO2 increase per year experiment for model MIROC6 (ensemble member r1i1p1f1). Anomalies are calculated relative to a pre-industrial control simulation of the same model. The horizontal dashed line indicates the transient climate response (TCR) defined as the 20-year average ΔT centered at the time of CO2 doubling (vertical dashed lines). |
download |
references |
extra data citation |
provenance
Time series of the global annual mean near-surface air temperature anomaly ΔT of the 1% CO2 increase per year experiment for model MPI-ESM1-2-HR (ensemble member r1i1p1f1). Anomalies are calculated relative to a pre-industrial control simulation of the same model. The horizontal dashed line indicates the transient climate response (TCR) defined as the 20-year average ΔT centered at the time of CO2 doubling (vertical dashed lines). |
download |
references |
extra data citation |
provenance
Time series of the global annual mean near-surface air temperature anomaly ΔT of the 1% CO2 increase per year experiment for model MPI-ESM1-2-LR (ensemble member r1i1p1f1). Anomalies are calculated relative to a pre-industrial control simulation of the same model. The horizontal dashed line indicates the transient climate response (TCR) defined as the 20-year average ΔT centered at the time of CO2 doubling (vertical dashed lines). |
download |
references |
extra data citation |
provenance
Time series of the global annual mean near-surface air temperature anomaly ΔT of the 1% CO2 increase per year experiment for model MRI-ESM2-0 (ensemble member r1i1p1f1). Anomalies are calculated relative to a pre-industrial control simulation of the same model. The horizontal dashed line indicates the transient climate response (TCR) defined as the 20-year average ΔT centered at the time of CO2 doubling (vertical dashed lines). |
download |
references |
extra data citation |
provenance
Time series of the global annual mean near-surface air temperature anomaly ΔT of the 1% CO2 increase per year experiment for model MultiModelMean. Anomalies are calculated relative to a pre-industrial control simulation of the same model. The horizontal dashed line indicates the transient climate response (TCR) defined as the 20-year average ΔT centered at the time of CO2 doubling (vertical dashed lines). |
download |
references |
extra data citation |
provenance
Time series of the global annual mean near-surface air temperature anomaly ΔT of the 1% CO2 increase per year experiment for model NESM3 (ensemble member r1i1p1f1). Anomalies are calculated relative to a pre-industrial control simulation of the same model. The horizontal dashed line indicates the transient climate response (TCR) defined as the 20-year average ΔT centered at the time of CO2 doubling (vertical dashed lines). |
download |
references |
extra data citation |
provenance
Time series of the global annual mean near-surface air temperature anomaly ΔT of the 1% CO2 increase per year experiment for model NorCPM1 (ensemble member r1i1p1f1). Anomalies are calculated relative to a pre-industrial control simulation of the same model. The horizontal dashed line indicates the transient climate response (TCR) defined as the 20-year average ΔT centered at the time of CO2 doubling (vertical dashed lines). |
download |
references |
extra data citation |
provenance
Time series of the global annual mean near-surface air temperature anomaly ΔT of the 1% CO2 increase per year experiment for model NorESM2-LM (ensemble member r1i1p1f1). Anomalies are calculated relative to a pre-industrial control simulation of the same model. The horizontal dashed line indicates the transient climate response (TCR) defined as the 20-year average ΔT centered at the time of CO2 doubling (vertical dashed lines). |
download |
references |
extra data citation |
provenance
Time series of the global annual mean near-surface air temperature anomaly ΔT of the 1% CO2 increase per year experiment for model SAM0-UNICON (ensemble member r1i1p1f1). Anomalies are calculated relative to a pre-industrial control simulation of the same model. The horizontal dashed line indicates the transient climate response (TCR) defined as the 20-year average ΔT centered at the time of CO2 doubling (vertical dashed lines). |
download |
references |
extra data citation |
provenance
Time series of the global annual mean near-surface air temperature anomaly ΔT of the 1% CO2 increase per year experiment for model UKESM1-0-LL (ensemble member r1i1p1f2). Anomalies are calculated relative to a pre-industrial control simulation of the same model. The horizontal dashed line indicates the transient climate response (TCR) defined as the 20-year average ΔT centered at the time of CO2 doubling (vertical dashed lines). |
download |
references |
extra data citation |
provenance