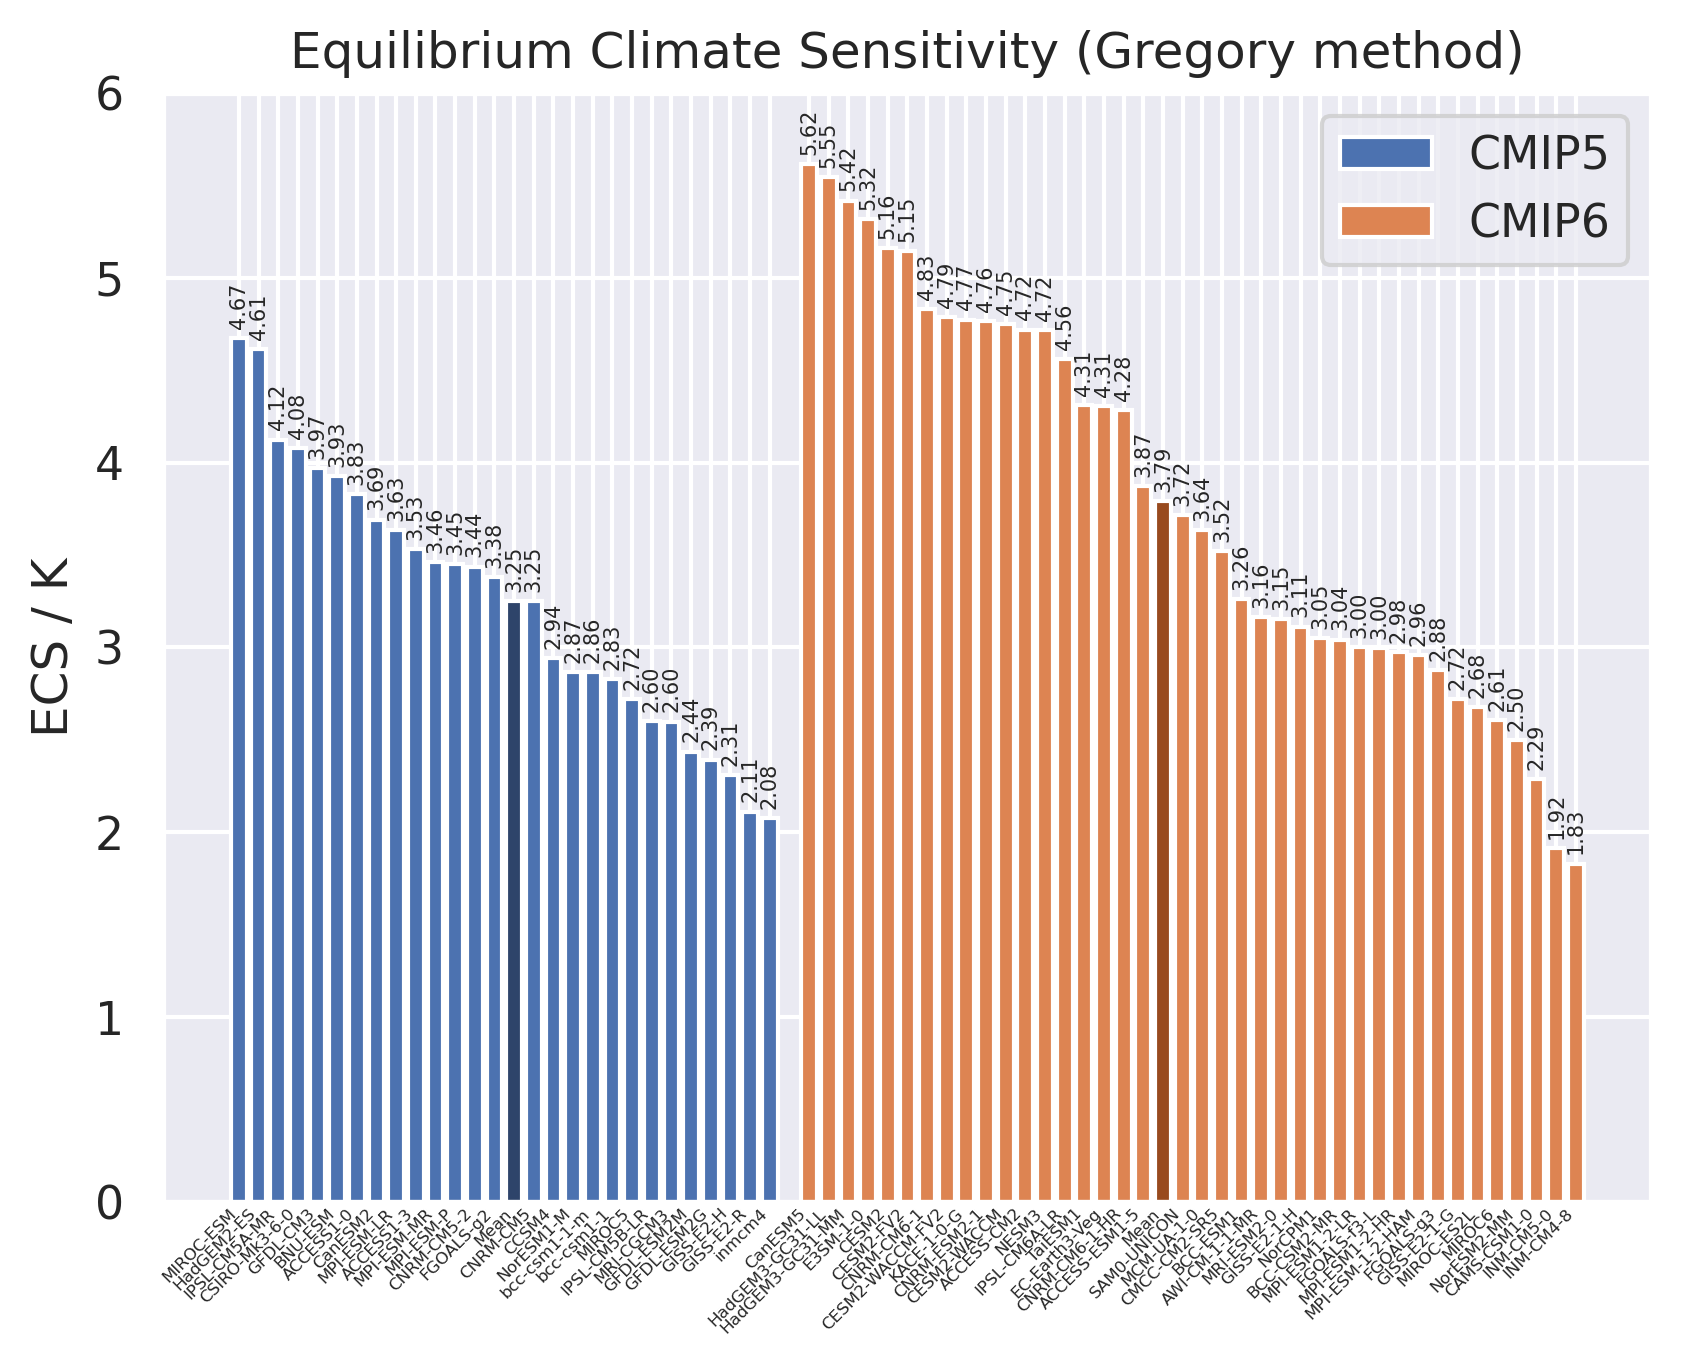
Scatterplot between TOA radiance and global mean surface temperature anomaly for 150 years of the abrupt 4x CO2 experiment including linear regression to calculate ECS for ACCESS1-0 (CMIP5).
Scatterplot between TOA radiance and global mean surface temperature anomaly for 150 years of the abrupt 4x CO2 experiment including linear regression to calculate ECS for ACCESS1-3 (CMIP5).
Scatterplot between TOA radiance and global mean surface temperature anomaly for 150 years of the abrupt 4x CO2 experiment including linear regression to calculate ECS for BNU-ESM (CMIP5).
Scatterplot between TOA radiance and global mean surface temperature anomaly for 150 years of the abrupt 4x CO2 experiment including linear regression to calculate ECS for CCSM4 (CMIP5).
Scatterplot between TOA radiance and global mean surface temperature anomaly for 150 years of the abrupt 4x CO2 experiment including linear regression to calculate ECS for CNRM-CM5-2 (CMIP5).
Scatterplot between TOA radiance and global mean surface temperature anomaly for 150 years of the abrupt 4x CO2 experiment including linear regression to calculate ECS for CNRM-CM5 (CMIP5).
Scatterplot between TOA radiance and global mean surface temperature anomaly for 150 years of the abrupt 4x CO2 experiment including linear regression to calculate ECS for CSIRO-Mk3-6-0 (CMIP5).
Scatterplot between TOA radiance and global mean surface temperature anomaly for 150 years of the abrupt 4x CO2 experiment including linear regression to calculate ECS for CanESM2 (CMIP5).
Scatterplot between TOA radiance and global mean surface temperature anomaly for 150 years of the abrupt 4x CO2 experiment including linear regression to calculate ECS for FGOALS-g2 (CMIP5).
Scatterplot between TOA radiance and global mean surface temperature anomaly for 150 years of the abrupt 4x CO2 experiment including linear regression to calculate ECS for GFDL-CM3 (CMIP5).
Scatterplot between TOA radiance and global mean surface temperature anomaly for 150 years of the abrupt 4x CO2 experiment including linear regression to calculate ECS for GFDL-ESM2G (CMIP5).
Scatterplot between TOA radiance and global mean surface temperature anomaly for 150 years of the abrupt 4x CO2 experiment including linear regression to calculate ECS for GFDL-ESM2M (CMIP5).
Scatterplot between TOA radiance and global mean surface temperature anomaly for 150 years of the abrupt 4x CO2 experiment including linear regression to calculate ECS for GISS-E2-H (CMIP5).
Scatterplot between TOA radiance and global mean surface temperature anomaly for 150 years of the abrupt 4x CO2 experiment including linear regression to calculate ECS for GISS-E2-R (CMIP5).
Scatterplot between TOA radiance and global mean surface temperature anomaly for 150 years of the abrupt 4x CO2 experiment including linear regression to calculate ECS for HadGEM2-ES (CMIP5).
Scatterplot between TOA radiance and global mean surface temperature anomaly for 150 years of the abrupt 4x CO2 experiment including linear regression to calculate ECS for IPSL-CM5A-MR (CMIP5).
Scatterplot between TOA radiance and global mean surface temperature anomaly for 150 years of the abrupt 4x CO2 experiment including linear regression to calculate ECS for IPSL-CM5B-LR (CMIP5).
Scatterplot between TOA radiance and global mean surface temperature anomaly for 150 years of the abrupt 4x CO2 experiment including linear regression to calculate ECS for MIROC-ESM (CMIP5).
Scatterplot between TOA radiance and global mean surface temperature anomaly for 150 years of the abrupt 4x CO2 experiment including linear regression to calculate ECS for MIROC5 (CMIP5).
Scatterplot between TOA radiance and global mean surface temperature anomaly for 150 years of the abrupt 4x CO2 experiment including linear regression to calculate ECS for MPI-ESM-LR (CMIP5).
Scatterplot between TOA radiance and global mean surface temperature anomaly for 150 years of the abrupt 4x CO2 experiment including linear regression to calculate ECS for MPI-ESM-MR (CMIP5).
Scatterplot between TOA radiance and global mean surface temperature anomaly for 150 years of the abrupt 4x CO2 experiment including linear regression to calculate ECS for MPI-ESM-P (CMIP5).
Scatterplot between TOA radiance and global mean surface temperature anomaly for 150 years of the abrupt 4x CO2 experiment including linear regression to calculate ECS for MRI-CGCM3 (CMIP5).
Scatterplot between TOA radiance and global mean surface temperature anomaly for 150 years of the abrupt 4x CO2 experiment including linear regression to calculate ECS for NorESM1-M (CMIP5).
Scatterplot between TOA radiance and global mean surface temperature anomaly for 150 years of the abrupt 4x CO2 experiment including linear regression to calculate ECS for bcc-csm1-1-m (CMIP5).
Scatterplot between TOA radiance and global mean surface temperature anomaly for 150 years of the abrupt 4x CO2 experiment including linear regression to calculate ECS for bcc-csm1-1 (CMIP5).
Scatterplot between TOA radiance and global mean surface temperature anomaly for 150 years of the abrupt 4x CO2 experiment including linear regression to calculate ECS for inmcm4 (CMIP5).
Scatterplot between TOA radiance and global mean surface temperature anomaly for 150 years of the abrupt 4x CO2 experiment including linear regression to calculate ECS for ACCESS1-0 (CMIP5). |
download |
references |
extra data citation |
provenance
Scatterplot between TOA radiance and global mean surface temperature anomaly for 150 years of the abrupt 4x CO2 experiment including linear regression to calculate ECS for ACCESS1-3 (CMIP5). |
download |
references |
extra data citation |
provenance
Scatterplot between TOA radiance and global mean surface temperature anomaly for 150 years of the abrupt 4x CO2 experiment including linear regression to calculate ECS for BNU-ESM (CMIP5). |
download |
references |
extra data citation |
provenance
Scatterplot between TOA radiance and global mean surface temperature anomaly for 150 years of the abrupt 4x CO2 experiment including linear regression to calculate ECS for CCSM4 (CMIP5). |
download |
references |
extra data citation |
provenance
Scatterplot between TOA radiance and global mean surface temperature anomaly for 150 years of the abrupt 4x CO2 experiment including linear regression to calculate ECS for CNRM-CM5-2 (CMIP5). |
download |
references |
extra data citation |
provenance
Scatterplot between TOA radiance and global mean surface temperature anomaly for 150 years of the abrupt 4x CO2 experiment including linear regression to calculate ECS for CNRM-CM5 (CMIP5). |
download |
references |
extra data citation |
provenance
Scatterplot between TOA radiance and global mean surface temperature anomaly for 150 years of the abrupt 4x CO2 experiment including linear regression to calculate ECS for CSIRO-Mk3-6-0 (CMIP5). |
download |
references |
extra data citation |
provenance
Scatterplot between TOA radiance and global mean surface temperature anomaly for 150 years of the abrupt 4x CO2 experiment including linear regression to calculate ECS for CanESM2 (CMIP5). |
download |
references |
extra data citation |
provenance
Scatterplot between TOA radiance and global mean surface temperature anomaly for 150 years of the abrupt 4x CO2 experiment including linear regression to calculate ECS for FGOALS-g2 (CMIP5). |
download |
references |
extra data citation |
provenance
Scatterplot between TOA radiance and global mean surface temperature anomaly for 150 years of the abrupt 4x CO2 experiment including linear regression to calculate ECS for GFDL-CM3 (CMIP5). |
download |
references |
extra data citation |
provenance
Scatterplot between TOA radiance and global mean surface temperature anomaly for 150 years of the abrupt 4x CO2 experiment including linear regression to calculate ECS for GFDL-ESM2G (CMIP5). |
download |
references |
extra data citation |
provenance
Scatterplot between TOA radiance and global mean surface temperature anomaly for 150 years of the abrupt 4x CO2 experiment including linear regression to calculate ECS for GFDL-ESM2M (CMIP5). |
download |
references |
extra data citation |
provenance
Scatterplot between TOA radiance and global mean surface temperature anomaly for 150 years of the abrupt 4x CO2 experiment including linear regression to calculate ECS for GISS-E2-H (CMIP5). |
download |
references |
extra data citation |
provenance
Scatterplot between TOA radiance and global mean surface temperature anomaly for 150 years of the abrupt 4x CO2 experiment including linear regression to calculate ECS for GISS-E2-R (CMIP5). |
download |
references |
extra data citation |
provenance
Scatterplot between TOA radiance and global mean surface temperature anomaly for 150 years of the abrupt 4x CO2 experiment including linear regression to calculate ECS for HadGEM2-ES (CMIP5). |
download |
references |
extra data citation |
provenance
Scatterplot between TOA radiance and global mean surface temperature anomaly for 150 years of the abrupt 4x CO2 experiment including linear regression to calculate ECS for IPSL-CM5A-MR (CMIP5). |
download |
references |
extra data citation |
provenance
Scatterplot between TOA radiance and global mean surface temperature anomaly for 150 years of the abrupt 4x CO2 experiment including linear regression to calculate ECS for IPSL-CM5B-LR (CMIP5). |
download |
references |
extra data citation |
provenance
Scatterplot between TOA radiance and global mean surface temperature anomaly for 150 years of the abrupt 4x CO2 experiment including linear regression to calculate ECS for MIROC-ESM (CMIP5). |
download |
references |
extra data citation |
provenance
Scatterplot between TOA radiance and global mean surface temperature anomaly for 150 years of the abrupt 4x CO2 experiment including linear regression to calculate ECS for MIROC5 (CMIP5). |
download |
references |
extra data citation |
provenance
Scatterplot between TOA radiance and global mean surface temperature anomaly for 150 years of the abrupt 4x CO2 experiment including linear regression to calculate ECS for MPI-ESM-LR (CMIP5). |
download |
references |
extra data citation |
provenance
Scatterplot between TOA radiance and global mean surface temperature anomaly for 150 years of the abrupt 4x CO2 experiment including linear regression to calculate ECS for MPI-ESM-MR (CMIP5). |
download |
references |
extra data citation |
provenance
Scatterplot between TOA radiance and global mean surface temperature anomaly for 150 years of the abrupt 4x CO2 experiment including linear regression to calculate ECS for MPI-ESM-P (CMIP5). |
download |
references |
extra data citation |
provenance
Scatterplot between TOA radiance and global mean surface temperature anomaly for 150 years of the abrupt 4x CO2 experiment including linear regression to calculate ECS for MRI-CGCM3 (CMIP5). |
download |
references |
extra data citation |
provenance
Scatterplot between TOA radiance and global mean surface temperature anomaly for 150 years of the abrupt 4x CO2 experiment including linear regression to calculate ECS for NorESM1-M (CMIP5). |
download |
references |
extra data citation |
provenance
Scatterplot between TOA radiance and global mean surface temperature anomaly for 150 years of the abrupt 4x CO2 experiment including linear regression to calculate ECS for bcc-csm1-1-m (CMIP5). |
download |
references |
extra data citation |
provenance
Scatterplot between TOA radiance and global mean surface temperature anomaly for 150 years of the abrupt 4x CO2 experiment including linear regression to calculate ECS for bcc-csm1-1 (CMIP5). |
download |
references |
extra data citation |
provenance
Scatterplot between TOA radiance and global mean surface temperature anomaly for 150 years of the abrupt 4x CO2 experiment including linear regression to calculate ECS for inmcm4 (CMIP5). |
download |
references |
extra data citation |
provenance
Scatterplot between TOA radiance and global mean surface temperature anomaly for 150 years of the abrupt 4x CO2 experiment including linear regression to calculate ECS for ACCESS-CM2 (CMIP6).
Scatterplot between TOA radiance and global mean surface temperature anomaly for 150 years of the abrupt 4x CO2 experiment including linear regression to calculate ECS for ACCESS-ESM1-5 (CMIP6).
Scatterplot between TOA radiance and global mean surface temperature anomaly for 150 years of the abrupt 4x CO2 experiment including linear regression to calculate ECS for AWI-CM-1-1-MR (CMIP6).
Scatterplot between TOA radiance and global mean surface temperature anomaly for 150 years of the abrupt 4x CO2 experiment including linear regression to calculate ECS for BCC-CSM2-MR (CMIP6).
Scatterplot between TOA radiance and global mean surface temperature anomaly for 150 years of the abrupt 4x CO2 experiment including linear regression to calculate ECS for BCC-ESM1 (CMIP6).
Scatterplot between TOA radiance and global mean surface temperature anomaly for 150 years of the abrupt 4x CO2 experiment including linear regression to calculate ECS for CAMS-CSM1-0 (CMIP6).
Scatterplot between TOA radiance and global mean surface temperature anomaly for 150 years of the abrupt 4x CO2 experiment including linear regression to calculate ECS for CESM2-FV2 (CMIP6).
Scatterplot between TOA radiance and global mean surface temperature anomaly for 150 years of the abrupt 4x CO2 experiment including linear regression to calculate ECS for CESM2-WACCM-FV2 (CMIP6).
Scatterplot between TOA radiance and global mean surface temperature anomaly for 150 years of the abrupt 4x CO2 experiment including linear regression to calculate ECS for CESM2-WACCM (CMIP6).
Scatterplot between TOA radiance and global mean surface temperature anomaly for 150 years of the abrupt 4x CO2 experiment including linear regression to calculate ECS for CESM2 (CMIP6).
Scatterplot between TOA radiance and global mean surface temperature anomaly for 150 years of the abrupt 4x CO2 experiment including linear regression to calculate ECS for CMCC-CM2-SR5 (CMIP6).
Scatterplot between TOA radiance and global mean surface temperature anomaly for 150 years of the abrupt 4x CO2 experiment including linear regression to calculate ECS for CNRM-CM6-1-HR (CMIP6).
Scatterplot between TOA radiance and global mean surface temperature anomaly for 150 years of the abrupt 4x CO2 experiment including linear regression to calculate ECS for CNRM-CM6-1 (CMIP6).
Scatterplot between TOA radiance and global mean surface temperature anomaly for 150 years of the abrupt 4x CO2 experiment including linear regression to calculate ECS for CNRM-ESM2-1 (CMIP6).
Scatterplot between TOA radiance and global mean surface temperature anomaly for 150 years of the abrupt 4x CO2 experiment including linear regression to calculate ECS for CanESM5 (CMIP6).
Scatterplot between TOA radiance and global mean surface temperature anomaly for 150 years of the abrupt 4x CO2 experiment including linear regression to calculate ECS for E3SM-1-0 (CMIP6).
Scatterplot between TOA radiance and global mean surface temperature anomaly for 150 years of the abrupt 4x CO2 experiment including linear regression to calculate ECS for EC-Earth3-Veg (CMIP6).
Scatterplot between TOA radiance and global mean surface temperature anomaly for 150 years of the abrupt 4x CO2 experiment including linear regression to calculate ECS for FGOALS-f3-L (CMIP6).
Scatterplot between TOA radiance and global mean surface temperature anomaly for 150 years of the abrupt 4x CO2 experiment including linear regression to calculate ECS for FGOALS-g3 (CMIP6).
Scatterplot between TOA radiance and global mean surface temperature anomaly for 150 years of the abrupt 4x CO2 experiment including linear regression to calculate ECS for GISS-E2-1-G (CMIP6).
Scatterplot between TOA radiance and global mean surface temperature anomaly for 150 years of the abrupt 4x CO2 experiment including linear regression to calculate ECS for GISS-E2-1-H (CMIP6).
Scatterplot between TOA radiance and global mean surface temperature anomaly for 150 years of the abrupt 4x CO2 experiment including linear regression to calculate ECS for HadGEM3-GC31-LL (CMIP6).
Scatterplot between TOA radiance and global mean surface temperature anomaly for 150 years of the abrupt 4x CO2 experiment including linear regression to calculate ECS for HadGEM3-GC31-MM (CMIP6).
Scatterplot between TOA radiance and global mean surface temperature anomaly for 150 years of the abrupt 4x CO2 experiment including linear regression to calculate ECS for INM-CM4-8 (CMIP6).
Scatterplot between TOA radiance and global mean surface temperature anomaly for 150 years of the abrupt 4x CO2 experiment including linear regression to calculate ECS for INM-CM5-0 (CMIP6).
Scatterplot between TOA radiance and global mean surface temperature anomaly for 150 years of the abrupt 4x CO2 experiment including linear regression to calculate ECS for IPSL-CM6A-LR (CMIP6).
Scatterplot between TOA radiance and global mean surface temperature anomaly for 150 years of the abrupt 4x CO2 experiment including linear regression to calculate ECS for KACE-1-0-G (CMIP6).
Scatterplot between TOA radiance and global mean surface temperature anomaly for 150 years of the abrupt 4x CO2 experiment including linear regression to calculate ECS for MCM-UA-1-0 (CMIP6).
Scatterplot between TOA radiance and global mean surface temperature anomaly for 150 years of the abrupt 4x CO2 experiment including linear regression to calculate ECS for MIROC-ES2L (CMIP6).
Scatterplot between TOA radiance and global mean surface temperature anomaly for 150 years of the abrupt 4x CO2 experiment including linear regression to calculate ECS for MIROC6 (CMIP6).
Scatterplot between TOA radiance and global mean surface temperature anomaly for 150 years of the abrupt 4x CO2 experiment including linear regression to calculate ECS for MPI-ESM-1-2-HAM (CMIP6).
Scatterplot between TOA radiance and global mean surface temperature anomaly for 150 years of the abrupt 4x CO2 experiment including linear regression to calculate ECS for MPI-ESM1-2-HR (CMIP6).
Scatterplot between TOA radiance and global mean surface temperature anomaly for 150 years of the abrupt 4x CO2 experiment including linear regression to calculate ECS for MPI-ESM1-2-LR (CMIP6).
Scatterplot between TOA radiance and global mean surface temperature anomaly for 150 years of the abrupt 4x CO2 experiment including linear regression to calculate ECS for MRI-ESM2-0 (CMIP6).
Scatterplot between TOA radiance and global mean surface temperature anomaly for 150 years of the abrupt 4x CO2 experiment including linear regression to calculate ECS for NESM3 (CMIP6).
Scatterplot between TOA radiance and global mean surface temperature anomaly for 150 years of the abrupt 4x CO2 experiment including linear regression to calculate ECS for NorCPM1 (CMIP6).
Scatterplot between TOA radiance and global mean surface temperature anomaly for 150 years of the abrupt 4x CO2 experiment including linear regression to calculate ECS for NorESM2-MM (CMIP6).
Scatterplot between TOA radiance and global mean surface temperature anomaly for 150 years of the abrupt 4x CO2 experiment including linear regression to calculate ECS for SAM0-UNICON (CMIP6).
Scatterplot between TOA radiance and global mean surface temperature anomaly for 150 years of the abrupt 4x CO2 experiment including linear regression to calculate ECS for TaiESM1 (CMIP6).
Scatterplot between TOA radiance and global mean surface temperature anomaly for 150 years of the abrupt 4x CO2 experiment including linear regression to calculate ECS for ACCESS-CM2 (CMIP6). |
download |
references |
extra data citation |
provenance
Scatterplot between TOA radiance and global mean surface temperature anomaly for 150 years of the abrupt 4x CO2 experiment including linear regression to calculate ECS for ACCESS-ESM1-5 (CMIP6). |
download |
references |
extra data citation |
provenance
Scatterplot between TOA radiance and global mean surface temperature anomaly for 150 years of the abrupt 4x CO2 experiment including linear regression to calculate ECS for AWI-CM-1-1-MR (CMIP6). |
download |
references |
extra data citation |
provenance
Scatterplot between TOA radiance and global mean surface temperature anomaly for 150 years of the abrupt 4x CO2 experiment including linear regression to calculate ECS for BCC-CSM2-MR (CMIP6). |
download |
references |
extra data citation |
provenance
Scatterplot between TOA radiance and global mean surface temperature anomaly for 150 years of the abrupt 4x CO2 experiment including linear regression to calculate ECS for BCC-ESM1 (CMIP6). |
download |
references |
extra data citation |
provenance
Scatterplot between TOA radiance and global mean surface temperature anomaly for 150 years of the abrupt 4x CO2 experiment including linear regression to calculate ECS for CAMS-CSM1-0 (CMIP6). |
download |
references |
extra data citation |
provenance
Scatterplot between TOA radiance and global mean surface temperature anomaly for 150 years of the abrupt 4x CO2 experiment including linear regression to calculate ECS for CESM2-FV2 (CMIP6). |
download |
references |
extra data citation |
provenance
Scatterplot between TOA radiance and global mean surface temperature anomaly for 150 years of the abrupt 4x CO2 experiment including linear regression to calculate ECS for CESM2-WACCM-FV2 (CMIP6). |
download |
references |
extra data citation |
provenance
Scatterplot between TOA radiance and global mean surface temperature anomaly for 150 years of the abrupt 4x CO2 experiment including linear regression to calculate ECS for CESM2-WACCM (CMIP6). |
download |
references |
extra data citation |
provenance
Scatterplot between TOA radiance and global mean surface temperature anomaly for 150 years of the abrupt 4x CO2 experiment including linear regression to calculate ECS for CESM2 (CMIP6). |
download |
references |
extra data citation |
provenance
Scatterplot between TOA radiance and global mean surface temperature anomaly for 150 years of the abrupt 4x CO2 experiment including linear regression to calculate ECS for CMCC-CM2-SR5 (CMIP6). |
download |
references |
extra data citation |
provenance
Scatterplot between TOA radiance and global mean surface temperature anomaly for 150 years of the abrupt 4x CO2 experiment including linear regression to calculate ECS for CNRM-CM6-1-HR (CMIP6). |
download |
references |
extra data citation |
provenance
Scatterplot between TOA radiance and global mean surface temperature anomaly for 150 years of the abrupt 4x CO2 experiment including linear regression to calculate ECS for CNRM-CM6-1 (CMIP6). |
download |
references |
extra data citation |
provenance
Scatterplot between TOA radiance and global mean surface temperature anomaly for 150 years of the abrupt 4x CO2 experiment including linear regression to calculate ECS for CNRM-ESM2-1 (CMIP6). |
download |
references |
extra data citation |
provenance
Scatterplot between TOA radiance and global mean surface temperature anomaly for 150 years of the abrupt 4x CO2 experiment including linear regression to calculate ECS for CanESM5 (CMIP6). |
download |
references |
extra data citation |
provenance
Scatterplot between TOA radiance and global mean surface temperature anomaly for 150 years of the abrupt 4x CO2 experiment including linear regression to calculate ECS for E3SM-1-0 (CMIP6). |
download |
references |
extra data citation |
provenance
Scatterplot between TOA radiance and global mean surface temperature anomaly for 150 years of the abrupt 4x CO2 experiment including linear regression to calculate ECS for EC-Earth3-Veg (CMIP6). |
download |
references |
extra data citation |
provenance
Scatterplot between TOA radiance and global mean surface temperature anomaly for 150 years of the abrupt 4x CO2 experiment including linear regression to calculate ECS for FGOALS-f3-L (CMIP6). |
download |
references |
extra data citation |
provenance
Scatterplot between TOA radiance and global mean surface temperature anomaly for 150 years of the abrupt 4x CO2 experiment including linear regression to calculate ECS for FGOALS-g3 (CMIP6). |
download |
references |
extra data citation |
provenance
Scatterplot between TOA radiance and global mean surface temperature anomaly for 150 years of the abrupt 4x CO2 experiment including linear regression to calculate ECS for GISS-E2-1-G (CMIP6). |
download |
references |
extra data citation |
provenance
Scatterplot between TOA radiance and global mean surface temperature anomaly for 150 years of the abrupt 4x CO2 experiment including linear regression to calculate ECS for GISS-E2-1-H (CMIP6). |
download |
references |
extra data citation |
provenance
Scatterplot between TOA radiance and global mean surface temperature anomaly for 150 years of the abrupt 4x CO2 experiment including linear regression to calculate ECS for HadGEM3-GC31-LL (CMIP6). |
download |
references |
extra data citation |
provenance
Scatterplot between TOA radiance and global mean surface temperature anomaly for 150 years of the abrupt 4x CO2 experiment including linear regression to calculate ECS for HadGEM3-GC31-MM (CMIP6). |
download |
references |
extra data citation |
provenance
Scatterplot between TOA radiance and global mean surface temperature anomaly for 150 years of the abrupt 4x CO2 experiment including linear regression to calculate ECS for INM-CM4-8 (CMIP6). |
download |
references |
extra data citation |
provenance
Scatterplot between TOA radiance and global mean surface temperature anomaly for 150 years of the abrupt 4x CO2 experiment including linear regression to calculate ECS for INM-CM5-0 (CMIP6). |
download |
references |
extra data citation |
provenance
Scatterplot between TOA radiance and global mean surface temperature anomaly for 150 years of the abrupt 4x CO2 experiment including linear regression to calculate ECS for IPSL-CM6A-LR (CMIP6). |
download |
references |
extra data citation |
provenance
Scatterplot between TOA radiance and global mean surface temperature anomaly for 150 years of the abrupt 4x CO2 experiment including linear regression to calculate ECS for KACE-1-0-G (CMIP6). |
download |
references |
extra data citation |
provenance
Scatterplot between TOA radiance and global mean surface temperature anomaly for 150 years of the abrupt 4x CO2 experiment including linear regression to calculate ECS for MCM-UA-1-0 (CMIP6). |
download |
references |
extra data citation |
provenance
Scatterplot between TOA radiance and global mean surface temperature anomaly for 150 years of the abrupt 4x CO2 experiment including linear regression to calculate ECS for MIROC-ES2L (CMIP6). |
download |
references |
extra data citation |
provenance
Scatterplot between TOA radiance and global mean surface temperature anomaly for 150 years of the abrupt 4x CO2 experiment including linear regression to calculate ECS for MIROC6 (CMIP6). |
download |
references |
extra data citation |
provenance
Scatterplot between TOA radiance and global mean surface temperature anomaly for 150 years of the abrupt 4x CO2 experiment including linear regression to calculate ECS for MPI-ESM-1-2-HAM (CMIP6). |
download |
references |
extra data citation |
provenance
Scatterplot between TOA radiance and global mean surface temperature anomaly for 150 years of the abrupt 4x CO2 experiment including linear regression to calculate ECS for MPI-ESM1-2-HR (CMIP6). |
download |
references |
extra data citation |
provenance
Scatterplot between TOA radiance and global mean surface temperature anomaly for 150 years of the abrupt 4x CO2 experiment including linear regression to calculate ECS for MPI-ESM1-2-LR (CMIP6). |
download |
references |
extra data citation |
provenance
Scatterplot between TOA radiance and global mean surface temperature anomaly for 150 years of the abrupt 4x CO2 experiment including linear regression to calculate ECS for MRI-ESM2-0 (CMIP6). |
download |
references |
extra data citation |
provenance
Scatterplot between TOA radiance and global mean surface temperature anomaly for 150 years of the abrupt 4x CO2 experiment including linear regression to calculate ECS for NESM3 (CMIP6). |
download |
references |
extra data citation |
provenance
Scatterplot between TOA radiance and global mean surface temperature anomaly for 150 years of the abrupt 4x CO2 experiment including linear regression to calculate ECS for NorCPM1 (CMIP6). |
download |
references |
extra data citation |
provenance
Scatterplot between TOA radiance and global mean surface temperature anomaly for 150 years of the abrupt 4x CO2 experiment including linear regression to calculate ECS for NorESM2-MM (CMIP6). |
download |
references |
extra data citation |
provenance
Scatterplot between TOA radiance and global mean surface temperature anomaly for 150 years of the abrupt 4x CO2 experiment including linear regression to calculate ECS for SAM0-UNICON (CMIP6). |
download |
references |
extra data citation |
provenance
Scatterplot between TOA radiance and global mean surface temperature anomaly for 150 years of the abrupt 4x CO2 experiment including linear regression to calculate ECS for TaiESM1 (CMIP6). |
download |
references |
extra data citation |
provenance